Who buys the next production line?
Polishers and metrology systems follow customer capacity expansion. Separate those equipment orders from the later shipment of connectors and modules.
Japanese company research / English edition
6834 · INDIVIDUAL COMPANY DEEP DIVE
Base-case analytical framework
Can recurring connectors and MT fiber arrays take over as growth drivers before customer equipment CAPEX normalizes?
Follow the report’s eleven economic forecast buckets—from customer line expansion and qualification to shipments and revenue.
8-page English sample · edition dated 20 September 2026.
Request a quotation for the full report. The enquiry form does not place an order or collect payment.
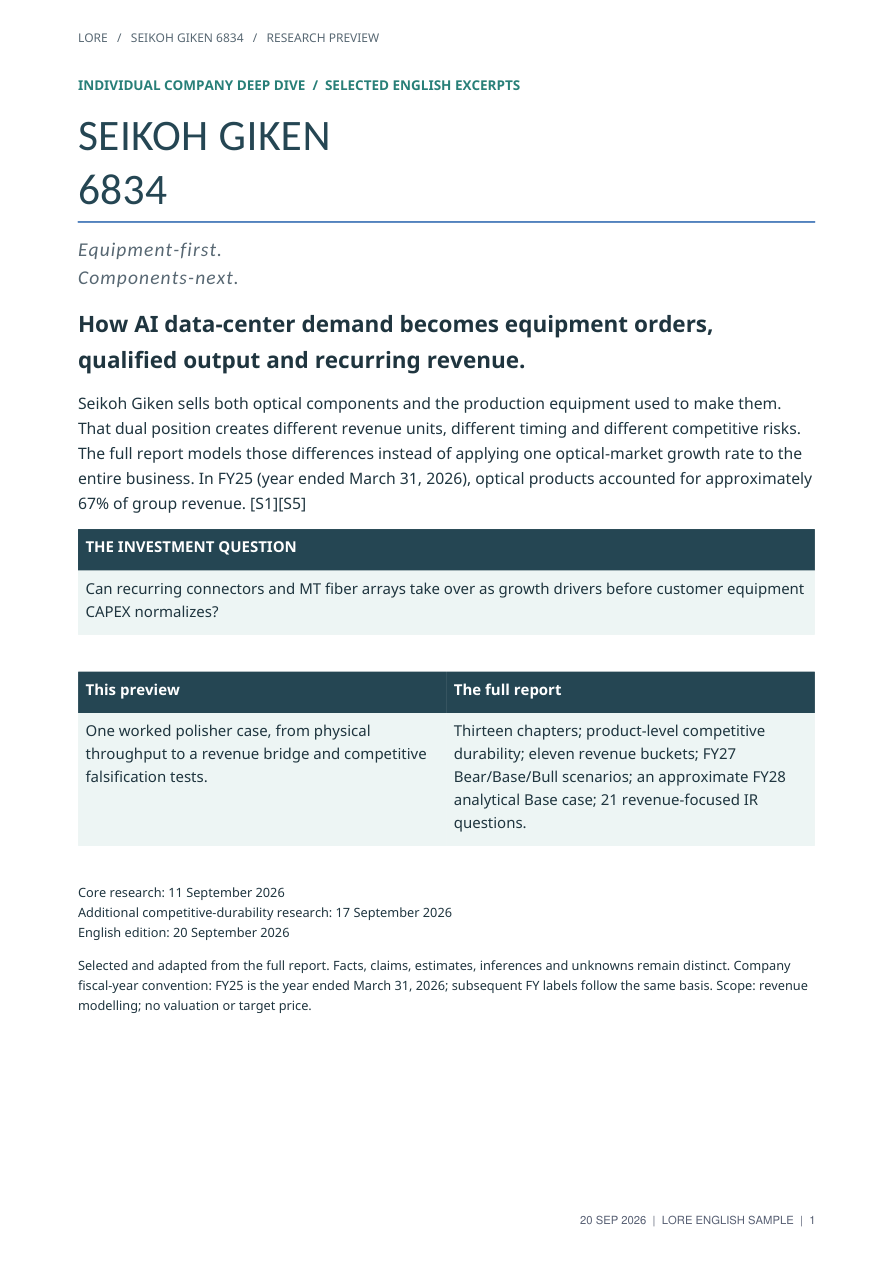
The English sample dated 20 September 2026. View sample details →
Product-level reasoning—not one optical-market growth rate applied to the whole company.
Polishers and metrology systems follow customer capacity expansion. Separate those equipment orders from the later shipment of connectors and modules.
Distinguish announced and installed capacity from customer-qualified, yield-adjusted output. For components, qualification and customer allocation are key model variables.
Test process compatibility, workflow retention, alternative suppliers and next-generation design wins. Keep company claims, estimates, inferences and unknowns separate.
Inside the eight-page sample
Start with a physical-throughput example. Move to the report’s estimated polisher revenue bridge, then examine the competitive conditions that would support—or challenge—the assumptions.
The sample identifies the limits of publicly available unit and ASP data. It does not claim that theoretical throughput is actual customer output or that all model inputs are observed facts.
See the sample contents →Thirteen chapters, including competitive durability, and appendices. The English full report contains 39 pages.
Company & products / Chapters 1–5
Company revenue structure, product functions, physical supply chains, end demand and quantity equations.
Competition / Chapter 6, including 6.5
Customer-versus-competitor relationships, product-level advantages, switching friction and erosion paths.
Model & capacity / Chapters 7–9
The FY26 revenue bridge, FY27 Bear/Base/Bull scenarios, an approximate FY28 analytical Base case, capacity conversion and technology transition. The later-year Base case is distinct from the reconstructed calculations.
Monitoring / Chapters 10–13 & appendices
Leading indicators, falsification conditions, 21 revenue-focused IR questions, final revenue equations, 47 source entries and calculation notes.
The people and publisher behind this report.
LORE Research is the research publishing brand of Lore, Ltd., Japan.
Research author
Author of the Japanese-language research underlying this report. The analysis examines products, external demand and supply-chain relationships to explain the company's revenue drivers.
Editing & publishing
Masashi Murata is responsible for the editing, publication and commercial enquiries for this report.
For publication and licensing enquiries, email research_sales@lore.co.jp or use the quotation form.
Purchase flow
Team licence
Starting price, excluding applicable taxes.
The final price and licence scope are set out in a written quotation.
No subscription or automatic research updates. External redistribution is not included. Purchase information →
Report availability & licensing
Tell us about your organisation, team and intended use. LORE will respond to the email address you provide with availability and licensing information.
Submitting this form is an enquiry, not an order. It creates no payment obligation. Please do not include confidential client information, payment details or passwords.
There is no automatic reply email. The full report is supplied separately under the agreed licence.
Prefer email? Contact Masashi Murata at research_sales@lore.co.jp.